 阿摩線上測驗
登入
阿摩線上測驗
登入
阿摩線上測驗
登入
阿摩線上測驗
登入
■The table below displays twenty actual observations of a binary variable Y and the predicted probability Pr (Y = 1lX) using a set of variable X.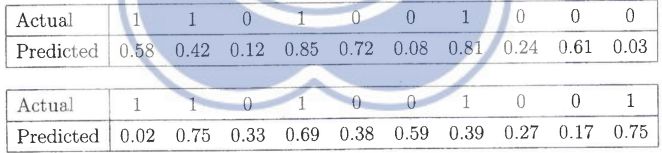 The odds of Y =1 relative to Y = O is__ (18)__ . Given the criterion
 = 1 if Pr(Y = 1|X) 2 0.5 and = 0 otherwise, the percent of correct prediction is __(19)__ and the coordinate on the receiver operating characteristic (ROC) curve is __(20)__.