題組內容
3. The following plot shows the pH curves for the titrations of various acids with 0.1 M NaOH (all the acids were 50.0 ml samples of 0.10 M concentration)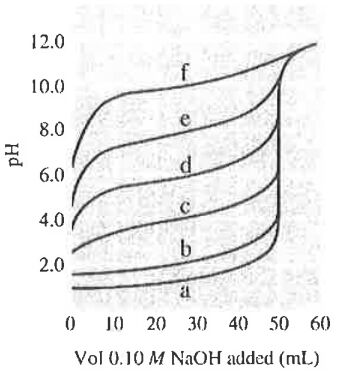
 阿摩線上測驗
登入
阿摩線上測驗
登入
3. The following plot shows the pH curves for the titrations of various acids with 0.1 M NaOH (all the acids were 50.0 ml samples of 0.10 M concentration)