阿摩線上測驗
題組內容
(四)本題為英文試題,請回答以下兩個小題:
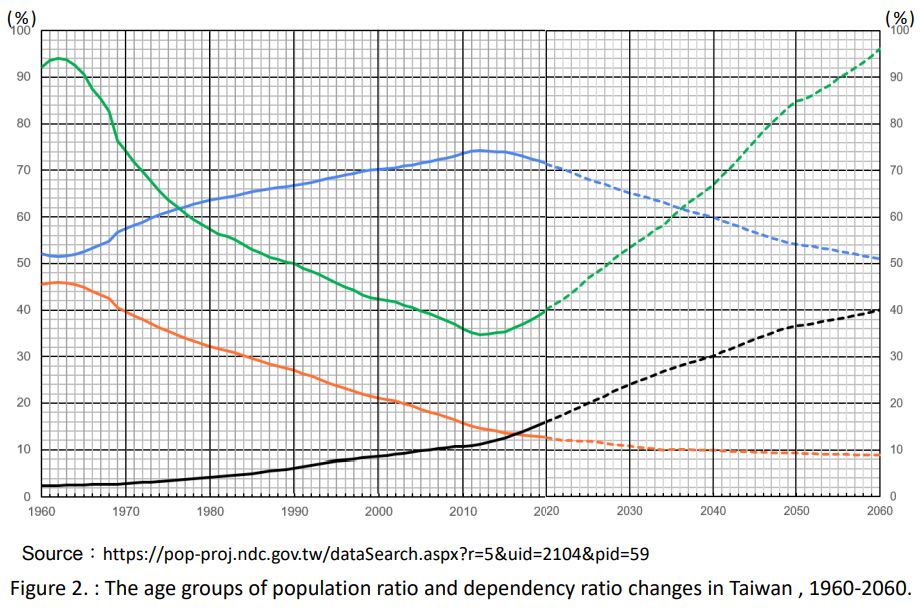
Figure 2. shows the age groups of population ratio and dependency ratio changes in Taiwan. The
four lines (randomly) are the young-age population ratio, the working-age population ratio, the old-age
population ratio and the dependency ratio. The data after 2021 are medium population projection.